HELLO, I’M A PRODUCT DESIGNER / NO-CODE DEVELOPER

Designer’s eye.
Builder’s mindset.

Turning complex problems into intuitive digital experiences. Blending product design, AI, no-code and development to bring ideas to life.

Restaurant Management App
04 / WEB APPLICATION · FRONT-END

One workspace for restaurant operations.

A responsive application for managing orders, menus, staff, inventory and reports.

Diagrams are illustrative. Client details are kept private.
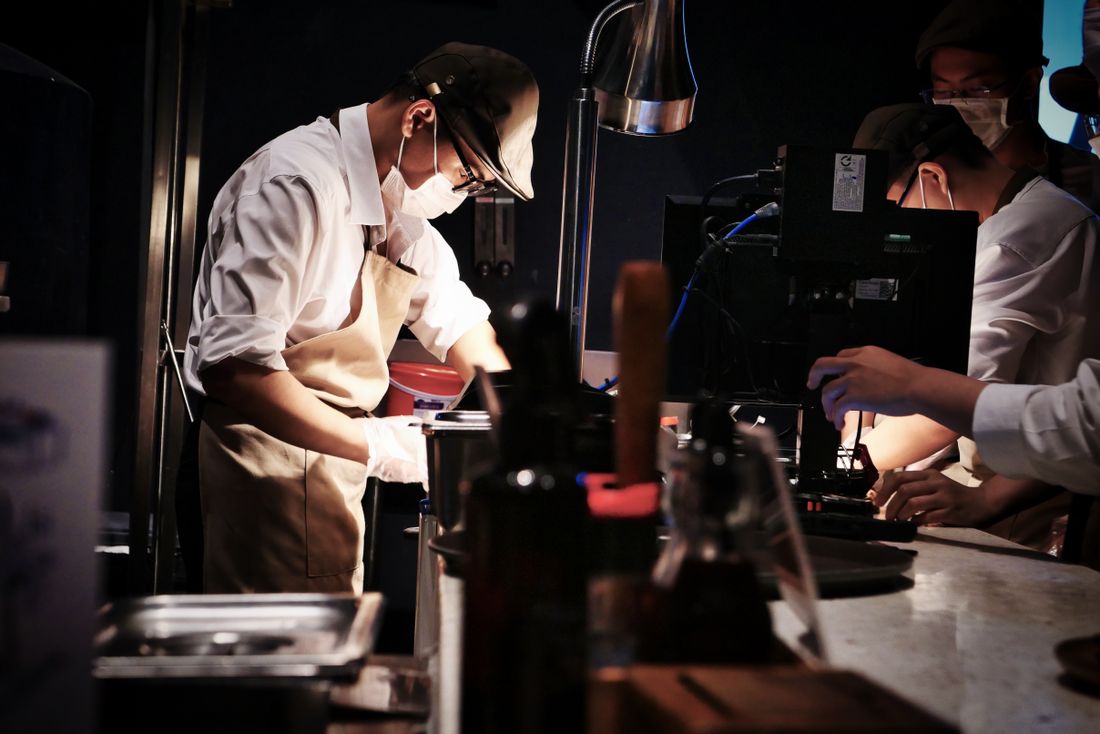
A chef working at a busy restaurant counter beside a point-of-sale screen
Photo: Pexels
INDUSTRY
Hospitality · Web application
CONTEXT
Front-end project
MY ROLE
Web application design · Front-end
SCOPE
Six screens, built in HTML, CSS and JavaScript
THE CHALLENGE

Restaurant teams juggle orders, menus, staff and stock under time pressure, often across disconnected tools.

WHAT I DESIGNED

A responsive management app with six screens: dashboard, orders, menu, staff, inventory and reports.

KEY SOLUTIONS
  • A dashboard that surfaces what needs attention now
  • Orders that read at a glance and work with one tap
  • Consistent management screens with modals and live charts
01 / OVERVIEW

Restaurant Management App

This is a responsive management app for restaurant operations, built in HTML, CSS and JavaScript. It has six screens, live stats, modals and dynamic charts.

I designed and built it end to end, so each design decision was tested in real code, including states, interactions and data visualisation.

What I executed

  • Task analysis of a service day
  • Six screen designs
  • Live stats and dynamic charts
  • Modals and interaction states
  • Responsive layouts
  • Front-end build in HTML, CSS and JavaScript
02 / CHALLENGES

What needed to change

Staff and manager challenges

  1. I need to see what is pending right now
  2. I am tapping fast, often with one hand
  3. I find out about low stock too late
  4. I can’t compare today with a normal day

Business challenges

  1. Slow order handling at peak times
  2. Stockouts and waste
  3. Menu and staff changes that take too long
  4. Little visibility into trends
03 / RESEARCH

What I discovered

Restaurant software is used under pressure, in short bursts, often on a tablet or phone. That shaped every decision about size, contrast and hierarchy.

Research methods

  • Task analysis of a service day, from order to report
  • Review of POS and restaurant dashboard UX guidance
  • Check against WCAG 2.2 target-size guidance
  • Screen inventory and data modelling
Key findingWhat it meant for the design

Restaurant interfaces are used under time pressure, so large tap targets, high contrast and colour-coded status are widely recommended.Dev.Pro on POS UX (opens in a new tab)

Primary actions are large and forgiving, and status is shown by colour and label together.

WCAG 2.2 sets a minimum size for pointer targets, with a larger enhanced size for easier use.W3C WCAG 2.2 (opens in a new tab)

Controls are sized well above the minimum, with spacing around them to prevent mis-taps.

In my task analysis, managers needed trends and priorities, not just totals, to decide what to do next.

Stats come with comparison and context, and the dashboard leads with what needs attention.

04 / PROCESS

From insight to interface

Because I built the app myself, design and code moved together. I could test an idea in the browser as soon as I had drawn it.

  1. 01Research
  2. 02Define
  3. 03User flow
  4. 04Wireframes
  5. 05UI design
  6. 06Front-end build
  7. 07Interactions
  8. 08Refine
  • Glanceable first

    The most important number or order is readable in a second.

  • Big, forgiving targets

    Controls are sized for fast, one-handed use.

  • Status is never colour alone

    Every state pairs colour with a label, so it reads in a bright kitchen or for colour-blind users.

  • One component language

    Cards, modals and charts behave the same across all six screens.

05 / HOW I SOLVED IT

Decisions, and what they cost

Every strong decision gives something up. These are the calls that shaped the experience, and the trade-offs I accepted.

01

One dashboard for what needs attention now

Solves: Staff finding out about problems too late

Key stats sit above a live chart and a short attention list, so the manager sees pending orders, low stock and the day’s trend before opening any other screen.

Trade-offFewer widgets on the home screen, with detail one tap away on the relevant screen.

Illustrative wireframe: dashboard
02

Orders that read at a glance

Solves: Slow order handling at peak times

Orders are grouped by status with large cards and one primary action each, so moving an order forward is a single tap.

Trade-offLess information per card, with the full order available in a modal.

Illustrative wireframe: orders board
03

Consistent management screens

Solves: Menu, staff and stock changes that take too long

Menu, staff and inventory share one list pattern with inline status, a clear low-stock signal and modals for adding or editing.

Trade-offA shared pattern limits bespoke layouts, but it makes every screen faster to learn.

Illustrative wireframe: inventory list
06 / READY FOR DEVELOPMENT

Built to stay consistent

Six screens share one set of components, which kept the build small and the experience consistent.

  1. FoundationsColour, type, spacing and status colours with labels
  2. ComponentsStat card, order card, list row, modal, chart, status badge
  3. PatternsFilter and sort, add and edit modal, confirm and undo
  4. ScreensDashboard, orders, menu, staff, inventory, reports

Developer handoff

  • Mobile-first responsive HTML, CSS and JavaScript
  • Reusable modal, card and chart components
  • Live stats and charts driven by data, not static images

Responsive across devices

The layout adapts from a wide dashboard to a single-column phone view, with primary actions kept within thumb reach.

States designed, not assumed

  • Empty list
  • New order
  • Delayed order
  • Low stock
  • Confirm in modal
  • Loading chart
  • Error
07 / IMPACT

How success is measured

I have not published outcome numbers here. These are the measures the design was built to move, and the ones I would track.

  • Time to confirm an order

    The core task during service, and the clearest speed measure.

  • Taps to complete a common task

    A simple check that the interface stays efficient.

  • Low-stock items caught before stockout

    Shows whether alerts arrive early enough to act on.

  • Report accuracy against source data

    Charts only build trust if the numbers are right.

08 / REFLECTION

What did I learn?

  • Building sharpened the design

    Seeing real states and data in the browser exposed layout problems that static mock-ups hid.

  • Dashboards need a point of view

    Leading with what needs attention beat showing every number equally.

  • Speed is a design requirement

    In a busy kitchen or dining room, fewer taps matter more than visual flourish.

What nextNext I would test the app with real staff on a tablet during a service, and refine sizes and flows based on what they actually do.

MORE PROJECTS

Continue exploring.